TADPOLE PORTAL
The most impressive aspect of the living world is it’s diversity. Ernst Mayr: "This is Biology"
Predator avoidance
Potential prey species do show several behavioural traits that allow to measure their perceived risk of predation. Those are, for example, foraging behaviour, habitat use, and temporal activity. An established method to measure perceived predation risk during foraging is “giving-up density” (GUD). Artificial patches of food are provided and the rate of depletion of these patches can be measured. The theoretical background is known as the marginal value theorem: with increasing depletion of the food patch the density of food decreases. A further depletion needs even more time. Therefore, beside the energy intake, the foraging animal has several costs: even more time for searching, the risk being caught by a predator, and the costs of missed opportunities. At a certain point, the benefits do not cover the costs anymore and animals should stop depleting the food patch. As part of the costs is the risk of predation, animals should leave the patch earlier if the perceived risk of predation is high. Comparing this marginal value between different sites allows estimating differences in (perceived) predation risk, given other variables are constant.
For investigations of habitat use, several methods are available. Depending on spatial scale and specific local conditions, radio tracking, powder tracking, or spool-and-line tracking might be a good choice. Additionally, radio tracking can uncover temporal activity patterns.
Giving-up densities
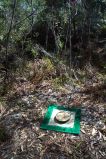
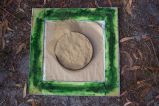
Giving-up density (GUD) has been a well working method to measure perceived predation risk in this system. Bush rats have a highly variable diet, mainly consisting of seeds and invertebrates. Both, in fox treatment (1080 poisoned baits) and non-treatment (unpoisoned baits) sites we have placed artificial food stations consisting of a defined number of linseeds within a matrix of fine, sieved sand. In all sites, we have placed food stations alternating in open and in densely covered places. The latter have been placed under shrubs or logs. We could therefore measure whether the rate of food intake (and therefore the perceived risk of predation) differs between treatment and non-treatment sites, between open and densely covered patches and whether the latter difference differs between treatment and non-treatment sites (fox activity).
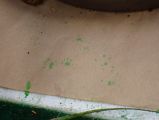
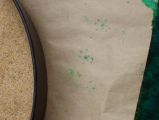
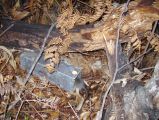
To find out which species were visiting our food stations, they were placed on a plastic plated which was surrounded by rubber foam. This was coloured with food dye and visiting species crossed this rubber foam and left food tracks on a piece of paper.
Spool-and-line tracking
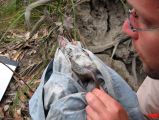
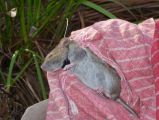
We caught rats late at night and attached a spool of thread (which uncoils from inside) at the rat’s back. We tied the loose end at some structure and released rats. At the next day, we could follow the thread and collect data on habitat used by the rat. It was very interesting, sometimes even funny, to see in such detail how these animals are moving. Spool-and-line tracking as method to measure habitat use has some advantages compared to other methods. There is no need to use UV-lamps such as for powder tracking and it does not depend on whether conditions. Additionally, it is not necessary to follow the rat right in the same night (this makes life more comfortable).
Differences in movements of bush rats between sites without (treatment) and with (non treatment) red foxes can highlight whether they prefer safer structures at higher fox activity; whether they recognise red foxes as predators and adapt habitat use – or not. We turned our attention to the use of understorey, ground cover, trees, and logs. The latter ones got more detailed attention: were rats moving on, next to or under logs?
